By Olov von Hofsten |
Luminance is arguably the most important component to analyze when evaluating a lighting design since it answer the fundamental question, “What will it look like?”. In Zemax you get easily get the luminance for an entire surface, but not the local luminance or luminace maps. However, there are ways around that, as often the case. In this post I will show my way of doing just that, and give some light guide design tips on the way.
Luminance is defined as “the intensity of light emitted from a surface per unit area in a given direction” (thanks Wikipedia). It’s measured in candela/m2, or nits. Don’t confuse it with illuminance which is the amount of luminous flux per unit area on a surface and measures in lumen/m2. Even if the illuminance is uniform on a surface, it may still not look uniform from all viewing angles (or any angle for that matter). To get perceived luminance maps of a surface, you need to consider where the light is going, using some type of aperture or measuring port (I will use the term aperture in this short article) to collect light.
I know of three ways to do this in Zemax. 1) Make an eye model, with a lens as aperture and a detector at the image position, 2) Use filter commands (e.g x_lgt(n,v), see “filter string”) to study light in a specific angle space and 3) use a detector at the emitting surface and filter it for rays going to the aperture plane. I find 1) tedious since you need to do focusing, which is especially hard when the aperture is large. 2) is ok, but also hard to overview and only works for square apertures. 3) is what I will go through here and is in my opinion the best way to do it.
To set this up I will use a simple lightguide illuminated by LEDs and a scattering surface at the top. I used the Eclipse logo and made an extrusion in a CAD-program, this is what it looks like. Now, normally I wouldn’t do a cylinder shaped lightguide since it can give you hotspots through focusing. A square lightguide would be much better, but the logo doesn’t allow an easy way to do this.
You can see that it is actually two lightguides, separated by a thin wall, in order to get the two colors of the logo.
Next step is to import the CAD file to Zemax and place some LEDs at the bottom of the light guide and a detector at the top. I used a “Detector color” sized a little bit larger than the light guide. I matched the color of the LEDs to the logo’s colors using “tristimulus XYZ” which is sort of cheating but we can leave color mixing with LEDs for a separate post. After some manual positioning of the LEDs to get spatially uniform illumination at the top of the light guide (a must if you want uniform luminance) we can start with the luminance simulations. I placed five 60 mm diameter apertures at a distance of 300 mm from the light guide, tilted +/-30 degrees from the normal of the top surface in both horizontal and vertical directions. You can think of these as eye positions.
The luminance map will be averaged over the aperture, so they can’t be too close and large since the luminance will vary. However, if they are too small you will end up with very many rays or a lot of noise. I used 1 million rays for every one of the four LEDs. You can experiment with “importance sampling” but I will not discuss it here.
So here’s the trick. Make a ray trace and save the rays to a ZRD-file. Then load this ray database to the emitter detector (see above) and filter the rays so you only see the rays hitting your aperture (“h12” in my case for the forward direction). This is what the detector viewer looks like, with filter “h12”.
Note that there is no scattering yet, and that the illumination on the detector is even, as seen in figure 2. However, without scattering you’re basically looking straight down at the LEDs.
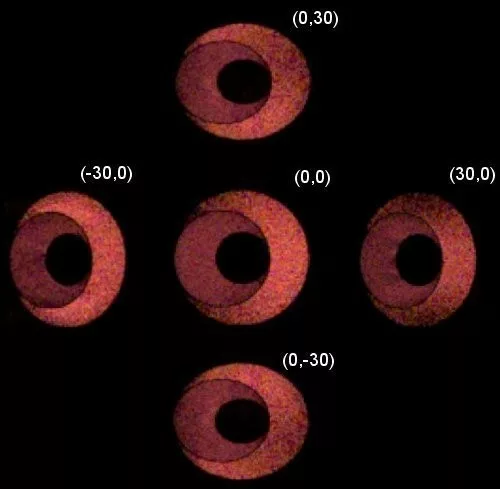
So we add scattering. I’m starting with a gaussian scattering with sigma = 0.11, which is approximately what you get by a simple sandpapering/sandblasting. We then repeat the simulation and see what happens. To get the luminance maps for the remaining four viewing angles, just change the filter string. I summarized the results below. The (x,y) angles for the apertures/viewing points are given for each image (i.e (-30,0) means we are viewing from -30 degree angle horisontally). In ImageJ, I added the projection of the logo, making it elliptical when viewed from the side and scaled the intensity with the peak values.
As you may notice, the luminance maps aren’t really uniform. We will need to add more scattering, which can be achieved in practice by a volume scattering plastic or an advanced film from e.g Luminit. In Zemax it is easier, just set the sigma of the gaussian scattering to 0.4 (corresponds to 40 degree FWHM gaussian scattering). Here’s what it looks like now:
Now it’s looking much more homogenous and nice! Of course, this comes with the price of about half the peak luminance but what did you expect? If you want to calculate the actual luminance values, you will need to divide by the solid angle of the aperture (small angle approximation only!). But beware, since the projected surface area does not change with angle in the detector viewer, the values need to be corrected for this if you are observing from the side.
For the next post I hope to have prototyped this to compare reality and simulations, stay tuned! And let me know in the comments if you have other related tips or questions!