
Sharpness and resolution, part I
By Henrik Eliasson |
Sharpness is one of the most important image quality attributes for a camera. Often, the sharpness and resolution of a camera system are confused and used interchangeably. In this post, I hope to sort out some of the confusion.

Figure 1. Same scene captured with two different lenses.
In Figure 1, two images of the same scene are shown. For a person with normal visual acuity, the left image should appear sharper than the right, but this will depend on the screen size as well. The difference becomes much more obvious when enlarging the images, as shown in Figure 2.

Figure 2. Magnified crops of images in Figure 1.
To some it may be surprising that, upon closer inspection, the foreground of the right image seems to contain more detail information compared to the foreground of the left image. This may seem contradictory to the fact that the overall sharpness is definitely lower in the right image. However, what this shows is rather that there is not necessarily a correlation between perceived sharpness and resolution in an image.
Resolution can apparently be regarded as the ability to determine fine detail in an image. The above example is an example of optical resolution, where the components in the optical path, most prominently the lens, will determine the resolution. In digital cameras, another type of resolution is the pixel resolution. This is determined by the number of pixels of the image sensor. A similar relation between the pixel resolution and sharpness can be found in this case as well. As seen in Figure 3, the perceived sharpness is about as high in all 4 images. Still, the top left image has four times the number of pixels compared to the top right, 16 times as many as the bottom left image and 64 times as many as the bottom right image. Clearly, the pixel resolution is not either correlated with the sharpness, at least in an obvious way.
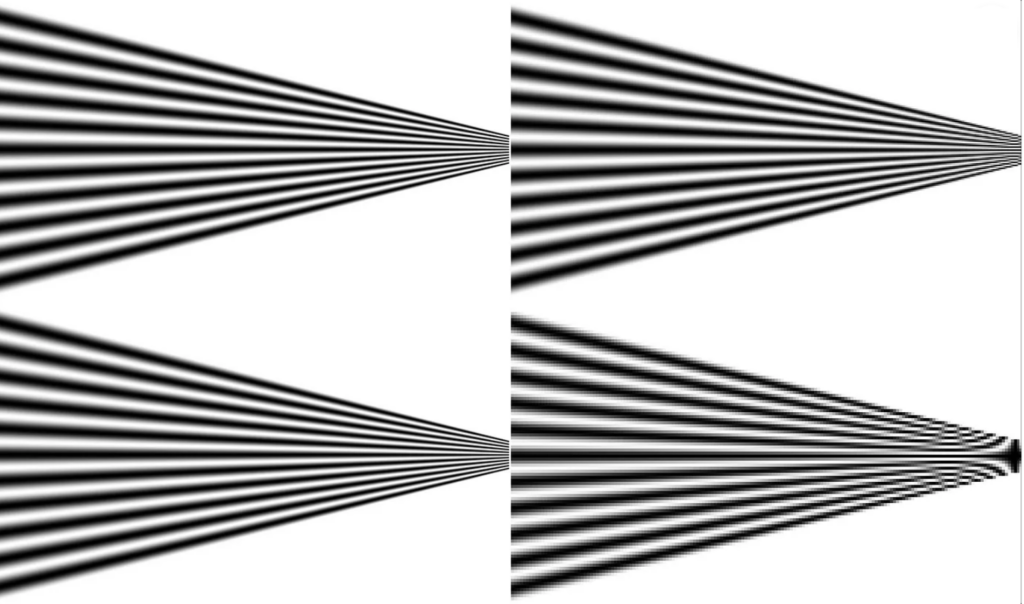
Figure 3. Images with progressively lower pixel resolution. Top left has highest resolution, bottom right 8 times lower resolution.
To explain better what is happening, we introduce the concept of modulation transfer function (MTF). As the name implies, this is a function that gives information about how the modulation gets modified as the signal is being transferred through the optical system. In the case considered here, we can regard the modulation as the attenuation of the image information as it goes through the camera system. This is a function spatial frequency, which provides information about the level of detail in a signal, as illustrated in Figure 4, showing a bar pattern with increasing spatial frequency from left to right.
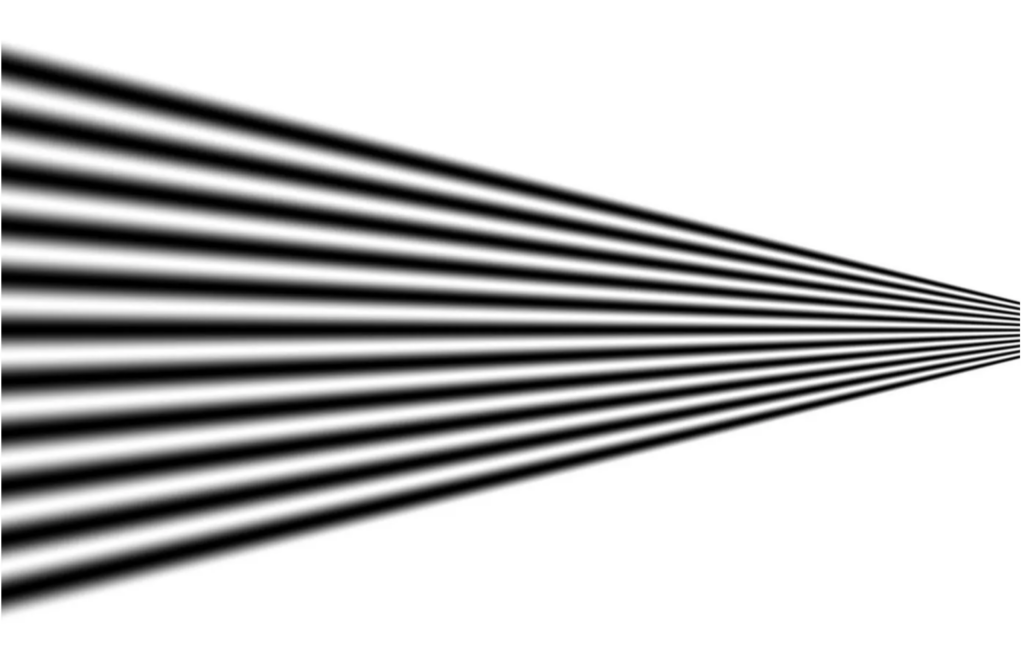
Figure 4. Illustration of spatial frequency. In this figure, the spatial frequency increases from left to right.
The MTFs of the systems responsible for the images in Figures 1 and 2 are shown in Figure 5. The red curve corresponds to the left images, and the blue to the right images. As can be seen, the red curve has considerably higher values for intermediate spatial frequencies, but lower values for the highest spatial frequencies compared to the blue curve.
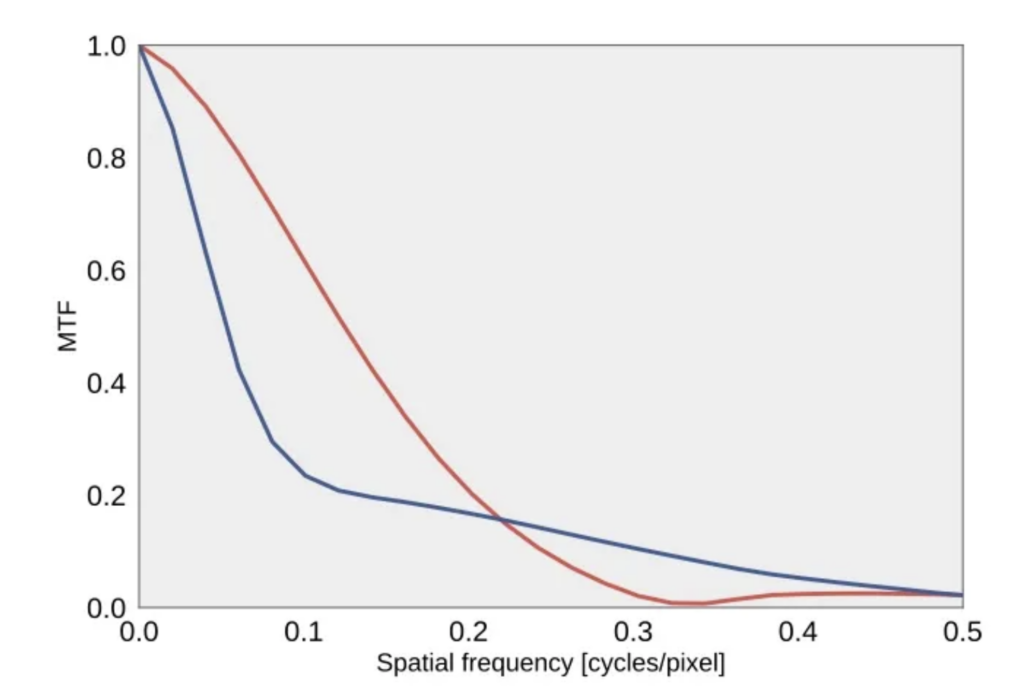
Figure 5. MTF corresponding to images in Figure 1 and Figure 2. Red curve: left image, blue curve: right image.
The impact of this can be seen more clearly if these two MTF curves are used to generate two new images, where the input object is the structure seen in Figure 4.
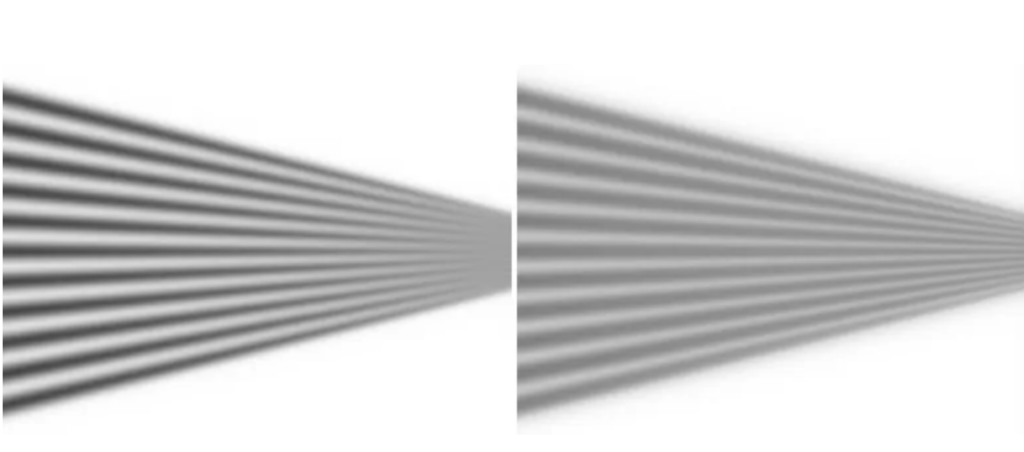
Figure 6. Left: image generated using the red MTF curve shown in Figure 5, right: image generated using the blue MTF curve in the same figure.
Here, we clearly see how the two MTF curves affect the passing of information of varying spatial frequency through the system. While the left image appears overall sharper, due to higher response at intermediate spatial frequencies, the right image retains detail all the way to the farthest right (for the highest spatial frequencies), while the left image does not.
When it comes to the pixel resolution, the situation is slightly different. Figure 7 shows the same target using a progressively smaller number of pixels. in this case as well, the perceived sharpness is not markedly different for the different images. However, if looking closely, some strange patterns will start to appear for the highest spatial frequencies and will become more widespread as the pixel resolution is decreased further.
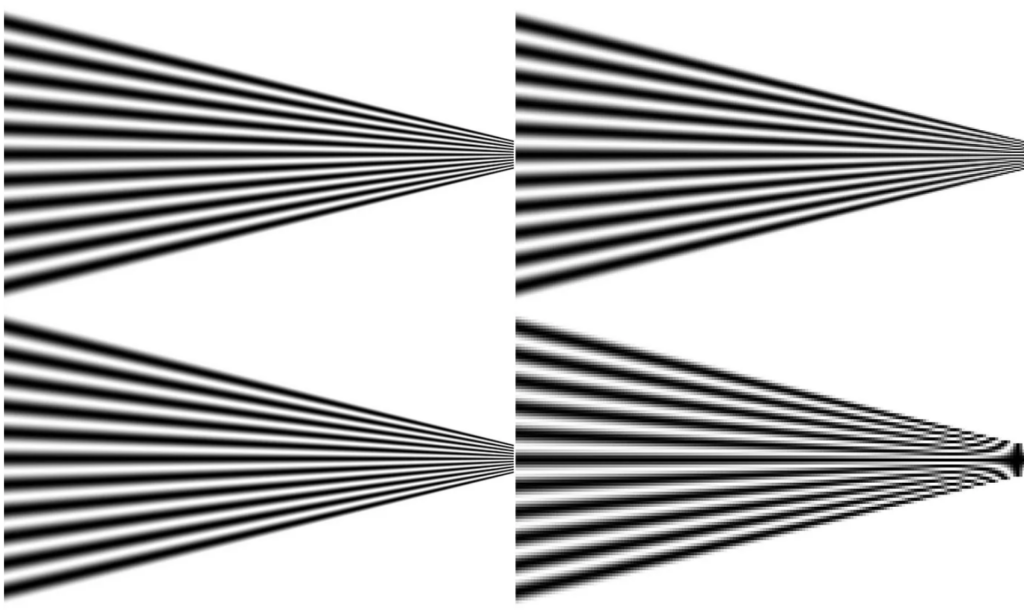
Figure 7. Test pattern with decreasing pixel resolution. Top right image has 4 times less resolution compared to the top left, bottom left 8 times as less, and bottom right 16 times less.
This behaviour may also be explained by the MTF to some extent. But this will be the topic of a future post.